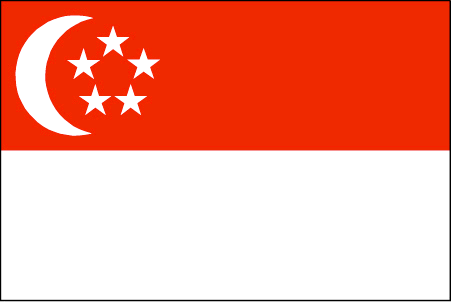
Singapore was founded as a British trading colony in 1819. It joined the Malaysian Federation in 1963 but separated two years later and became independent. Singapore subsequently became one of the world’s most prosperous countries with strong international trading links (its port is one of the world’s busiest in terms of tonnage handled) and with per capita GDP equal to that of the leading nations of Western Europe. Capital: Singapore Area: 719.1 km2 Population: 5,674,472 (July 2015 est.) Currency: Singapore dollar Languages: English, Tamil, Malay, Standard Mandarin (official) Singapore has a highly developed and successful free-market economy. It enjoys a remarkably open and corruption-free environment, stable prices, and a per capita GDP higher than that of most developed countries. The economy depends heavily on exports, particularly in consumer electronics, information technology products, pharmaceuticals, and on a growing financial services sector. The economy contracted 0.6% in 2009 as a result of the global financial crisis, but rebounded 15.1% in 2010, on the strength of renewed exports, before slowing to in 2011-13, largely a result of soft demand for exports during the second European recession. Over the longer term, the government hopes to establish a new growth path that focuses on raising productivity. Singapore has attracted major investments in pharmaceuticals and medical technology production and will continue efforts to establish Singapore as Southeast Asia’s financial and high-tech hub.
GDP (purchasing power parity): $339 billion (2013 est.) country comparison to the world: 41 $327.4 billion (2012 est.) $323.2 billion (2011 est.) note: data are in 2013 US dollars
$287.4 billion (2013 est.)
3.5% (2013 est.) country comparison to the world: 91 1.3% (2012 est.) 5.2% (2011 est.)
$62,400 (2013 est.) country comparison to the world: 7 $61,600 (2012 est.) $62,300 (2011 est.) note: data are in 2013 US dollars
48.3% of GDP (2013 est.) country comparison to the world: 5 45.6% of GDP (2012 est.) 46.8% of GDP (2011 est.)
GDP – composition, by end use: household consumption: 41% government consumption: 9.7% investment in fixed capital: 25.6% investment in inventories: 4.5% exports of goods and services: 195.8% imports of goods and services: -176.7% (2013 est.)
GDP – composition, by sector of origin: agriculture: 0% industry: 27.3% services: 72.7% (2013 est.)
orchids, vegetables; poultry, eggs; fish, ornamental fish
electronics, chemicals, financial services, oil drilling equipment, petroleum refining, rubber processing and rubber products, processed food and beverages, ship repair, offshore platform construction, life sciences, entrepot trade
Industrial production growth rate: 3.5% (2013 est.) country comparison to the world: 83
3.428 million country comparison to the world: 99 note: excludes non-residents (2013 est.)
agriculture: 0.1% industry: 19.6% services: 80.3% note: excludes non-residents (2011)
2.1% (2013 est.) country comparison to the world: 15 1.9% (2012 est.)
Population below poverty line: NA%
Household income or consumption by percentage share: lowest 10%: 4.4% highest 10%: 23.2% (2008)
Distribution of family income – Gini index: 47.8 (2012) country comparison to the world: 27 48.1 (2008)
revenues: $44.48 billion expenditures: $42.47 billion note: expenditures include both operational and development expenditures (2013 est.)
15.5% of GDP (2013 est.) country comparison to the world: 190
Budget surplus (+) or deficit (-): 0.7% of GDP (2013 est.) country comparison to the world: 31
113.6% of GDP (2013 est.) country comparison to the world: 10 111.4% of GDP (2012 est.) note: for Singapore, public debt consists largely of Singapore Government Securities (SGS) issued to assist the Central Provident Fund (CPF), which administers Singapore’s defined contribution pension fund; special issues of SGS are held by the CPF, and are non-tradable; the government has not borrowed to finance deficit expenditures since the 1980s; Singapore has no external public debt
1 April – 31 March
Inflation rate (consumer prices): 2.4% (2013 est.) country comparison to the world: 88 4.6% (2012 est.)
Commercial bank prime lending rate: 5.4% (31 December 2013 est.) country comparison to the world: 151 5.38% (31 December 2012 est.)
$124.8 billion (31 December 2013 est.) country comparison to the world: 29 $115 billion (31 December 2012 est.)
$400.9 billion (31 December 2013 est.) country comparison to the world: 26 $388.6 billion (31 December 2012 est.)
$302.7 billion (31 December 2013 est.) country comparison to the world: 35 $281.1 billion (31 December 2012 est.)
Market value of publicly traded shares: $414.1 billion (31 December 2012 est.) country comparison to the world: 26 $308.3 billion (31 December 2011) $370.1 billion (31 December 2010 est.)
$52.19 billion (2013 est.) country comparison to the world: 13 $51.44 billion (2012 est.)
$442.9 billion (2013 est.) country comparison to the world: 15 $435.8 billion (2012 est.)
machinery and equipment (including electronics and telecommunications), pharmaceuticals and other chemicals, refined petroleum products, food and beverages
Malaysia 12.3%, Hong Kong 10.9%, China 10.8%, Indonesia 10.6%, US 5.5%, Japan 4.6%, Australia 4.2%, South Korea 4% (2012)
$380.3 billion (2013 est.) country comparison to the world: 15 $374.9 billion (2012 est.)
machinery and equipment, mineral fuels, chemicals, foodstuffs, consumer goods
Malaysia 10.6%, China 10.3%, US 10.2%, South Korea 6.8%, Japan 6.2%, Indonesia 5.3%, Saudi Arabia 4.5%, UAE 4.1% (2012)
Reserves of foreign exchange and gold: $270.5 billion (31 December 2013 est.) country comparison to the world: 12 $259.1 billion (31 December 2012 est.)
$1.174 trillion (31 December 2012 est.) country comparison to the world: 16 $1.088 trillion (31 December 2011 est.)
Stock of direct foreign investment – at home: $800 billion (31 December 2013 est.) country comparison to the world: 10 $741 billion (31 December 2012 est.)
Stock of direct foreign investment – abroad: $445.1 billion (31 December 2013 est.) country comparison to the world: 16 $416.9 billion (31 December 2012 est.)
Singapore dollars (SGD) per US dollar – 1.25 (2013 est.) 1.2497 (2012 est.) 1.3635 (2010 est.) 1.4545 (2009) 1.415 (2008) BANKING Standard Chartered Bank 68 Orchard Road The Hong Kong and Shanghai Banking Corporation Ltd (HSBC) 21 Collyer Quay #01-01 /#02-01 (Premier Centre) DBS Bank 12 Marina Boulevard Overseas-Chinese Banking Corporation Ltd (OCBC) OCBC Centre, 65 Chulia Street United Overseas Banking Ltd (UOB) 80 Raffles Place UOB Plaza 1
Hong Leong Finance 16 Raffles Quay
SINGAPORE


Singapore (238839)
Website: http://www.standardchartered.com.sg/sme-banking/en/
Singapore (049320)
Website: http://www.hsbc.com.sg/1/2/business/small-businesses
Marina Bay Financial Centre Tower 3 Singapore (018982)
Website: http://www.dbs.com.sg/sme/
Year Established: 1968 (45 years)
Singapore (049513)
Website: http://www.ocbc.com.sg/business-banking/
Year Established: 1932 (81 years)
Singapore (048624)
Website: http://www.uob.com.sg/corporate/commercial/
Year Established: 1935 (78 years)
Singapore (048581)
Website: http://www.hlf.com.sg/enterprise/sme/sme_centre.html
Year Established: 1961 (52 years)


 English


