English


Vietnam
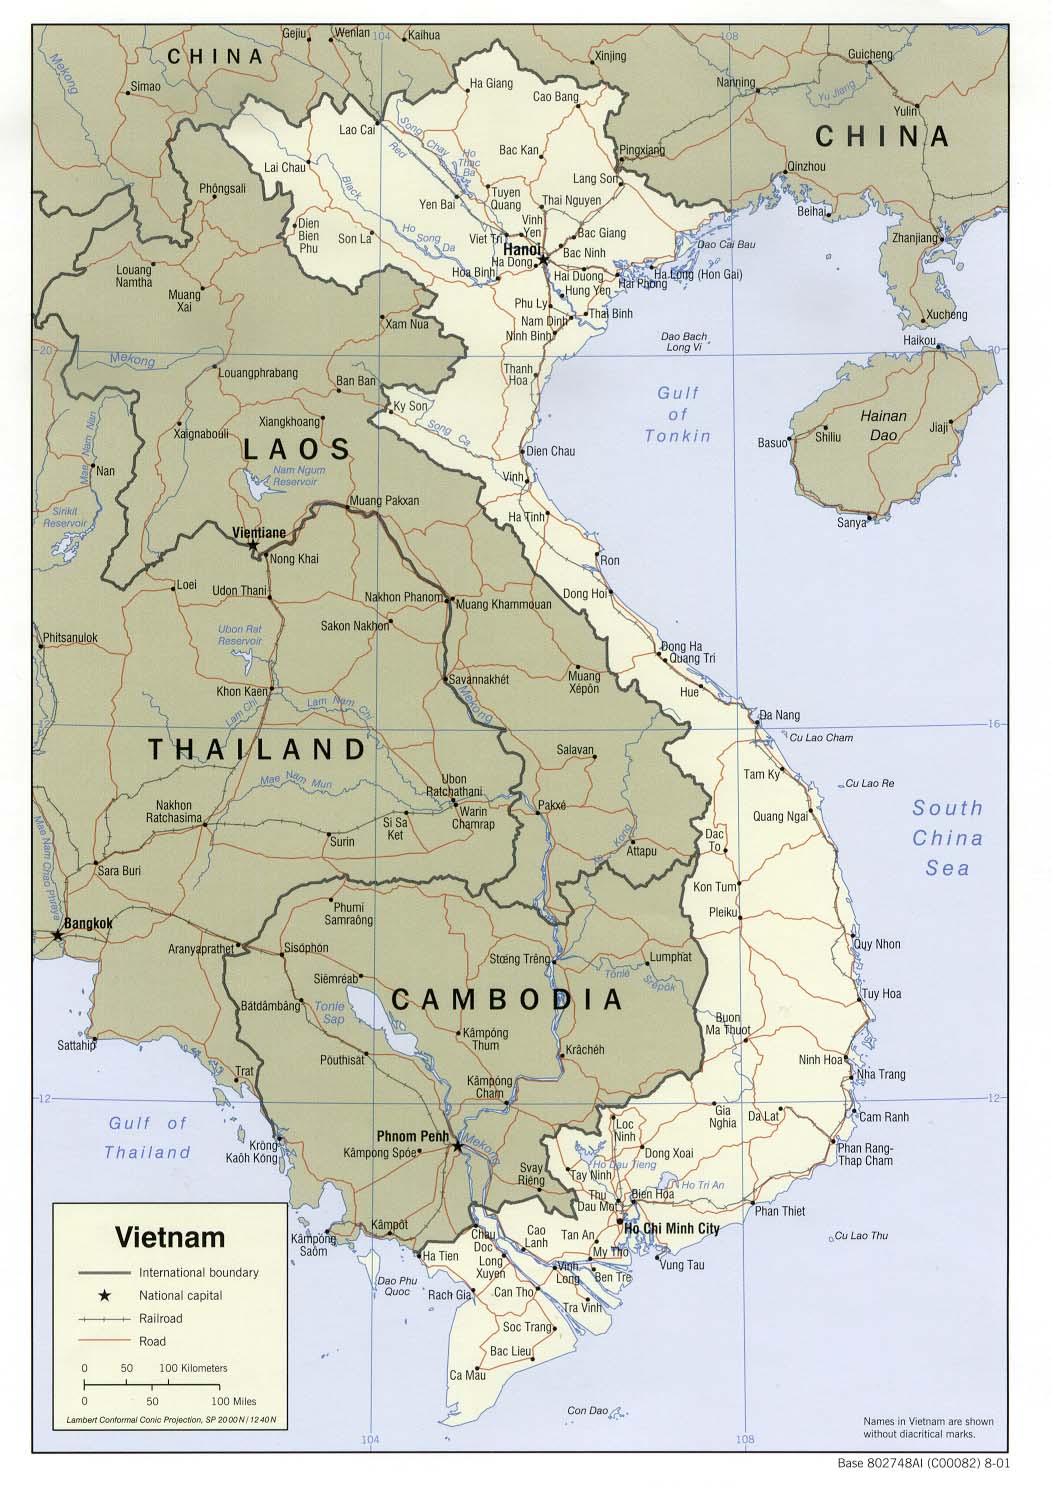
The conquest of Vietnam by France began in 1858 and was completed by 1884. It became part of French Indochina in 1887. Vietnam declared independence after World War II, but France continued to rule until its 1954 defeat by communist forces under Ho Chi MINH. Under the Geneva Accords of 1954, Vietnam was divided into the communist North and anti-communist South. US economic and military aid to South Vietnam grew through the 1960s in an attempt to bolster the government, but US armed forces were withdrawn following a cease-fire agreement in 1973. Two years later, North Vietnamese forces overran the South reuniting the country under communist rule. Despite the return of peace, for over a decade the country experienced little economic growth because of conservative leadership policies, the persecution and mass exodus of individuals – many of them successful South Vietnamese merchants – and growing international isolation. However, since the enactment of Vietnam’s “doi moi” (renovation) policy in 1986, Vietnamese authorities have committed to increased economic liberalization and enacted structural reforms needed to modernize the economy and to produce more competitive, export-driven industries. The communist leaders, however, maintain control on political expression and have resisted outside calls to improve human rights. The country continues to experience small-scale protests from various groups – the vast majority connected to land-use issues, calls for increased political space, and the lack of equitable mechanisms for resolving disputes. Various ethnic minorities, such as the Montagnards of the Central Highlands and the Khmer Krom in the southern delta region, have also held protests. Capital: Ha Noi Area: 331,210 km2 (water: 21,140 km2) Population: 94,348,835 (July 2015 est.) Currency: Vietnamese Dong (VND) Languages: Vietnamese (official), English, French, Chinese, Khmer Vietnam is a densely-populated developing country that has been transitioning from the rigidities of a centrally-planned economy since 1986. Vietnamese authorities have reaffirmed their commitment to economic modernization in recent years. Vietnam joined the World Trade Organization in January 2007, which has promoted more competitive, export-driven industries. Vietnam became an official negotiating partner in the Trans-Pacific Partnership trade agreement in 2010. Agriculture’s share of economic output has continued to shrink from about 25% in 2000 to less than 20% in 2013, while industry’s share increased from 36% to more than 42% in the same period. State-owned enterprises account for about 40% of GDP. Poverty has declined significantly, and Vietnam is working to create jobs to meet the challenge of a labor force that is growing by more than one million people every year. The global recession hurt Vietnam’s export-oriented economy, with GDP in 2013 growing at 5%, the slowest rate of growth since 1999. In 2013, however, exports increased by more than 12%, year-on-year; several administrative actions brought the trade deficit back into balance. Between 2008 and 2011, Vietnam’s managed currency, the dong, was devalued in excess of 20%, but its value remained relatively stable in 2013. Hanoi has oscillated between promoting growth and emphasizing macroeconomic stability in recent years. In February 2011, the government shifted from policies aimed at achieving a high rate of economic growth, which had stoked inflation, to those aimed at stabilizing the economy, through tighter monetary and fiscal control. Although Vietnam unveiled a broad, “three pillar” economic reform program in early 2012, proposing the restructuring of public investment, state-owned enterprises, and the banking sector, little perceptible progress has been made. Vietnam’s economy continues to face challenges from an under-capitalized banking sector. Non-performing loans weigh heavily on banks and businesses.
GDP (purchasing power parity): $358.9 billion (2013 est.) country comparison to the world: 39 $340.8 billion (2012 est.) $323.8 billion (2011 est.) note: data are in 2013 US dollars
$170 billion (2013 est.)
5.3% (2013 est.) country comparison to the world: 50 5.2% (2012 est.) 6.2% (2011 est.)
$4,000 (2013 est.) country comparison to the world: 169 $3,800 (2012 est.) $3,700 (2011 est.) note: data are in 2013 US dollars
38.4% of GDP (2013 est.) country comparison to the world: 12 39% of GDP (2012 est.) 32.8% of GDP (2011 est.)
GDP – composition, by end use: household consumption: 68.9% government consumption: 6.8% investment in fixed capital: 30.4% investment in inventories: 3.1% exports of goods and services: 84.7% imports of goods and services: -93.9% (2013 est.)
GDP – composition, by sector of origin: agriculture: 19.3% industry: 38.5% services: 42.2% (2013 est.)
paddy rice, coffee, rubber, tea, pepper, soybeans, cashews, sugar cane, peanuts, bananas; poultry; fish, seafood
food processing, garments, shoes, machine-building; mining, coal, steel; cement, chemical fertilizer, glass, tires, oil, mobile phones
Industrial production growth rate: 5% (2013 est.) country comparison to the world: 55
52.93 million (2013 est.) country comparison to the world: 11
agriculture: 48% industry: 21% services: 31% (2012)
1.3% (2013 est.) country comparison to the world: 7 3.2% (2012 est.)
Population below poverty line: 11.3% (2012 est.)
Household income or consumption by percentage share: lowest 10%: 3.2% highest 10%: 30.2% (2008)
Distribution of family income – Gini index: 37.6 (2008) country comparison to the world: 78 36.1 (1998)
revenues: $42.82 billion expenditures: $50 billion (2013 est.)
25.2% of GDP (2013 est.) country comparison to the world: 125
Budget surplus (+) or deficit (-): -4.2% of GDP (2013 est.) country comparison to the world: 152
48.2% of GDP (2013 est.) country comparison to the world: 70 48.1% of GDP (2012 est.) note: official data; data cover general government debt, and includes debt instruments issued (or owned) by government entities other than the treasury; the data include treasury debt held by foreign entities; the data include debt issued by sub-national entities, as well as intra-governmental debt; intra-governmental debt consists of treasury borrowings from surpluses in the social funds, such as for retirement, medical care, and unemployment; debt instruments for the social funds are not sold at public auctions
calendar year
Inflation rate (consumer prices): 6.8% (2013 est.) country comparison to the world: 184 9.1% (2012 est.)
9% (31 December 2012) country comparison to the world: 11 15% (31 December 2011)
Commercial bank prime lending rate: 10.5% (31 December 2013 est.) country comparison to the world: 57 13.47% (31 December 2012 est.)
$43.99 billion (31 December 2013 est.) country comparison to the world: 50 $40.34 billion (31 December 2012 est.)
$184.9 billion (31 December 2013 est.) country comparison to the world: 40 $165.9 billion (31 December 2012 est.)
$173.8 billion (31 December 2013 est.) country comparison to the world: 43 $163.5 billion (31 December 2012 est.)
Market value of publicly traded shares: $38.2 billion (31 December 2011 est.) country comparison to the world: 58 $26 billion (31 December 2011) $37 billion (31 December 2010 est.)
$8.162 billion (2013 est.) country comparison to the world: 25 $9.062 billion (2012 est.)
$128.9 billion (2013 est.) country comparison to the world: 34 $114.6 billion (2012 est.)
clothes, shoes, electronics, seafood, crude oil, rice, coffee, wooden products, machinery
US 17.8%, Japan 11.8%, China 11.2%, South Korea 5%, Malaysia 4.1% (2012)
$121.4 billion (2013 est.) country comparison to the world: 33 $104.7 billion (2012 est.)
machinery and equipment, petroleum products, steel products, raw materials for the clothing and shoe industries, electronics, plastics, automobiles
China 25.8%, South Korea 13.9%, Japan 10.4%, Singapore 6%, Thailand 5.2%, US 4.3% (2012)
Reserves of foreign exchange and gold: $32.49 billion (31 December 2013 est.) country comparison to the world: 51 $26.11 billion (31 December 2012 est.)
$68.38 billion (31 December 2013 est.) country comparison to the world: 56 $63.95 billion (31 December 2012 est.)
Stock of direct foreign investment – at home: $84.61 billion (31 December 2013 est.) country comparison to the world: 44 $73.71 billion (31 December 2012 est.)
Stock of direct foreign investment – abroad: $7.7 billion (31 December 2009 est.) country comparison to the world: 59 $5.3 billion (31 December 2008)
dong (VND) per US dollar – 21,118 (2013 est.) 20,859 (2012 est.) 18,612.92 (2010 est.) 17,799.6 (2009) 16,548.3 (2008)
BANKING The Vietnam Development Bank 25A Cat Linh Street, Dong Da District Ha Noi, Vietnam Ho Chi Minh City Credit Guarantee Fund for SMEs 33 Pasteur, District 1 Bac Ninh Credit Guarantee Fund for SMEs Huyen Quang Road, Bac Ninh Province, Vietnam Ha Giang Credit Guarantee Fund for SMEs 6 Bach Dang Road
[/vc_column_text][/vc_column_inner][/vc_row_inner][/well][/vc_column][/vc_row]VIETNAM

Website: www.vdb.gov.vn
Email: [email protected]
Ho Chi Minh City, Vietnam
Website: www.hcgf.com.vn
Email: [email protected]
Ha Giang Province, Vietnam
Email: [email protected]